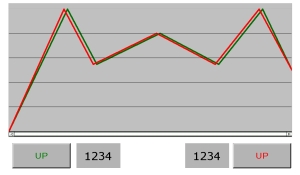
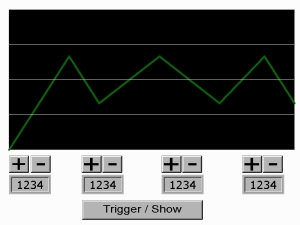
Some people use to doubts what Graph utility is better for his application, in this case I would like to explain the differences between Trend Graph and Historical Trend Graph.
The historical Trend graph is the typical tool to see graphically the evolution in time of some variable, for example, temperature or pressure.
The Trend graph is the tool to show graphically several values in the same graph without the time basis. This graph could be useful, for example, to show the evolution of the different temperatures in a different oven’s chain.
To make easy the implementation of these tools, please check the next examples:

